Introduction
Digital Thread Impact Analysis visualizes how changes to a system parameter affect other parts of the system, showing what will need to be re-analyzed if a parameter is modified.
Overview
Digital Thread Impact Analysis is a visualization tool within the Interactive Service Dashboard (ISD) that helps Subject Matter Experts (SMEs) understand the ripple effects of changing a system parameter. It uses color-coded network graphs to show upstream (what affects the parameter) and downstream (what the parameter affects) elements in the system model. This tool is crucial for efficient system redesign and impact assessment during tradespace analysis.
|
Digital Thread Impact Analysis is not just a visualization tool—it’s a decision support mechanism that helps SMEs identify the most effective parameters to modify for desired system outcomes. |
|
The Digital Thread Impact Analysis dashboard is part of the Interactive Service Dashboard (ISD) that also includes the Decision Dashboard. The Decision Dashboard helps evaluate trade-offs across multiple objectives, while the Digital Thread Impact Analysis helps understand how changes to parameters propagate through the system. |
Position in Knowledge Hierarchy
Broader concepts: - Part IV (is-a)
Details
Core Functionality
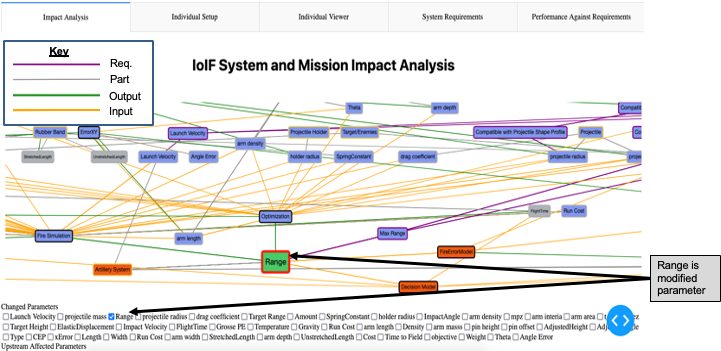
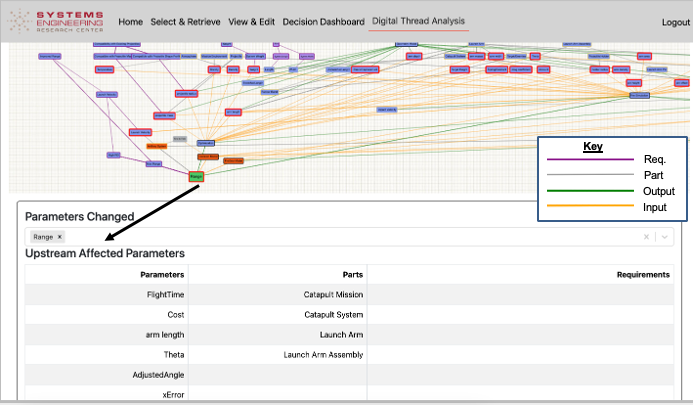
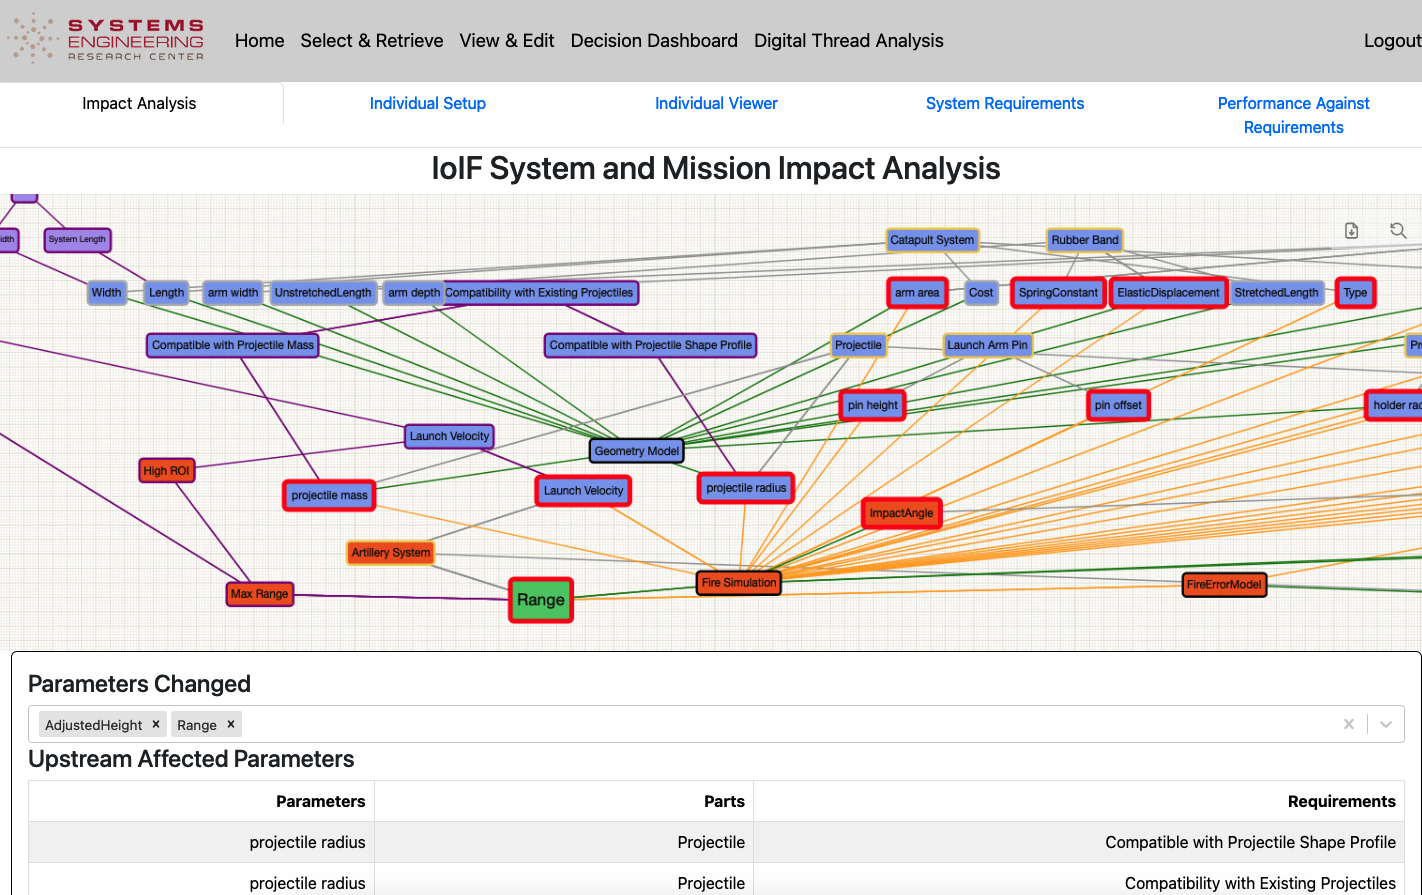
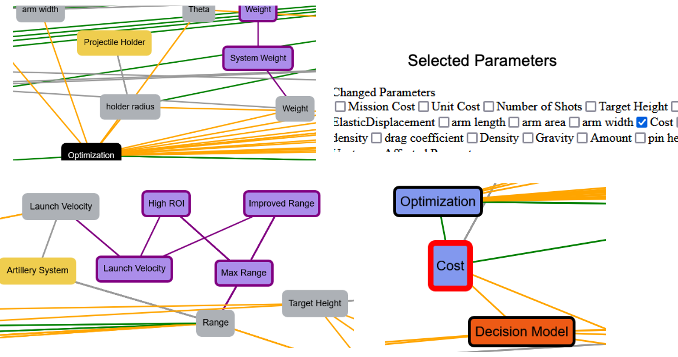
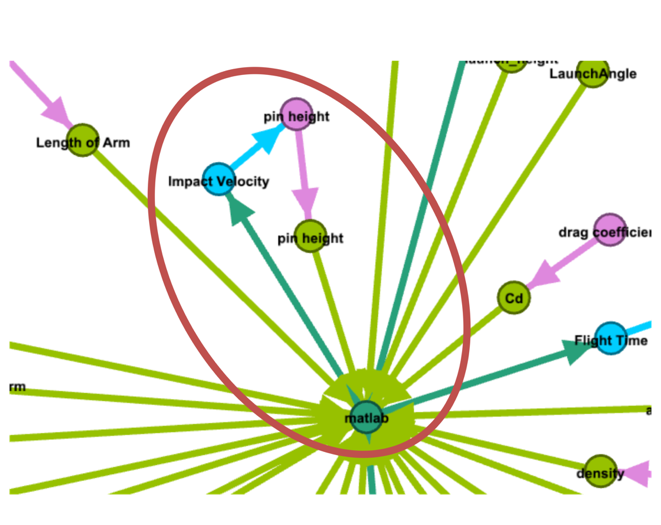
The Digital Thread Impact Analysis dashboard provides a visual representation of how parameters in the Assessment Flow Diagram (AFD) relate to each other and to system requirements. When a user selects a parameter (e.g., "Range" or "Cost"), the dashboard highlights: - Selected parameters: Rendered with larger font, green background, and red outline - Upstream parameters: Parameters that feed into the selected parameter (shown in blue) - Downstream parameters: Parameters affected by the selected parameter (shown in orange) - Unaffected elements: Remain unchanged (retain original colors)
Visualization System
The dashboard uses a color-coded system to distinguish different types of elements:
Element Type |
Color Code |
Parameters |
Gray |
System Parts |
Yellow |
Requirements |
Purple |
Models |
Black |
Input to model |
Yellow |
Output of model |
Green |
Trait of entity |
Gray |
Requirement MOE |
Purple |
Selected Parameter |
Red outline |
Upstream Elements |
Blue |
Downstream Elements |
Orange |
|
The color-coding system is consistent across all Digital Thread Impact Analysis visualizations, but the specific colors used may vary depending on the implementation. Always verify the legend in the specific dashboard instance. |
Technical Implementation
The Digital Thread Impact Analysis dashboard operates through the following technical workflow:
-
Initialization: The dashboard retrieves system information from the IoIF triplestore using the direct interface
-
Data Retrieval: It queries the triplestore for AFD connections using SPARQL
-
Impact Calculation: Using the AFD sequence data, it calculates upstream/downstream relationships
-
Visualization: It renders the graph with appropriate color coding
-
Update Handling: When a parameter is selected, it updates the visualization to show affected elements
The dashboard uses the direct interface to interact with the triplestore, performing: - SPARQL SELECT queries to retrieve data - SPARQL DELETE queries to clear existing information - SPARQL INSERT queries to publish updates
= Example code snippet showing how the dashboard interacts with the triplestore
def update_impact_analysis(selected_parameters):
    # Clear existing impact data
    sparql_delete = f"""
    DELETE WHERE {{
        ?subject ?predicate ?object .
        FILTER (?subject IN ({','.join(selected_parameters)}))
    }}
    """
    triplestore.update(sparql_delete)

    # Calculate impact based on AFD connections
    upstream = calculate_upstream(selected_parameters)
    downstream = calculate_downstream(selected_parameters)

    # Update visualization with new impact data
    sparql_insert = f"""
    INSERT DATA {{
        {create_triples(upstream, 'upstream')}
        {create_triples(downstream, 'downstream')}
    }}
    """
    triplestore.update(sparql_insert)
Relationship to Other Components
The Digital Thread Impact Analysis dashboard works in concert with several other components:
|
The Digital Thread Impact Analysis dashboard is not a standalone tool—it’s designed to be used in conjunction with the Decision Dashboard. The typical workflow is: 1. Use the Decision Dashboard to identify a trade-off (e.g., high performance but high cost) 2. Switch to Digital Thread Impact Analysis to identify parameters that could be modified to reduce cost 3. Use the "Smart Copy" feature to initialize a new analysis with optimized parameters |
Practical applications and examples
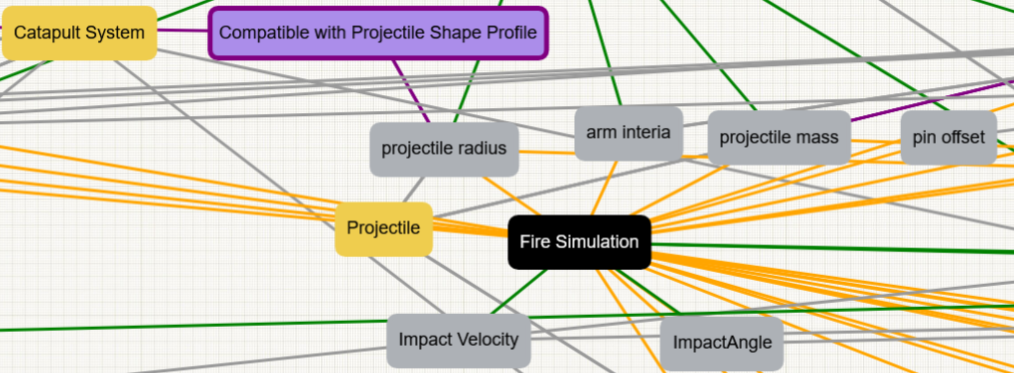
Catapult System Example
The Catapult system is used as a case study to demonstrate Digital Thread Impact Analysis:
-
Initial Analysis: The Decision Dashboard shows that the Catapult has high performance (Range) but high cost.
-
Impact Analysis: The user selects "Cost" in the Digital Thread Impact Analysis dashboard.
-
Visualization: The dashboard highlights:
-
Upstream parameters: Spring constant, material thickness, etc.
-
Downstream parameters: Range, Impact Velocity, etc.
-
-
Insight: The SME identifies that reducing the spring constant could lower cost, but this would also reduce Range.
-
Action: The SME selects the spring constant as a parameter to optimize, and the dashboard provides a "Smart Copy" feature to initialize a new analysis with modified parameters.
|
The Catapult example demonstrates how Digital Thread Impact Analysis transforms a qualitative understanding of system relationships into a quantitative, actionable insight for system redesign. |
Workflow Integration
The Digital Thread Impact Analysis fits into the overall IoIF workflow as shown below:
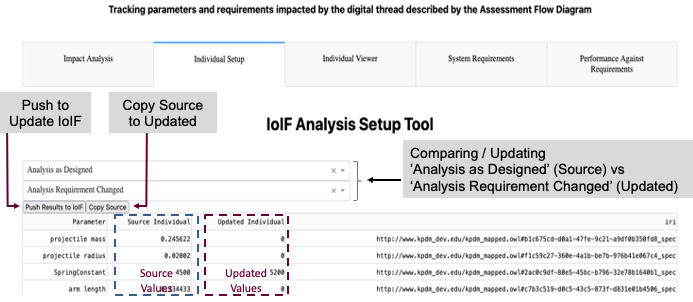
Smart Copy Feature
The Digital Thread Impact Analysis dashboard includes a "Smart Copy" feature that allows users to:
-
Select an instance (e.g., "Analysis as Designed")
-
Choose parameters to copy (upstream parameters)
-
Initialize a new instance with those parameters
-
Modify downstream parameters as needed
This feature significantly reduces the time required to set up new analyses by automatically populating parameters that are unaffected by the change.
|
The Smart Copy feature only copies upstream parameters and unaffected parameters. Downstream parameters are not copied, as they would need to be recalculated based on the new upstream values. |
Related wiki pages
References
SPARQL 1.1 Query Language
RDF 1.1 Concepts and Abstract Syntax
OWL 2 Web Ontology Language Overview
Protégé Ontology Editor
SysML v2 Specification
Common Core Ontologies
Dunbar et al., "Driving Digital Engineering Integration and Interoperability Through Semantic Integration of Models with Ontologies", Systems Engineering Journal, 2023
Semantic Web Data Standards
Knowledge Graph
Visualize the relationships between Digital Thread Impact Analysis and related concepts
Associated Diagrams